
Measuring employee advocacy means connecting the work your team does on LinkedIn to the business purpose behind it. For a manufacturer, that purpose may be helping buyers understand an application, improving access to relevant people, or making technical expertise easier to find before a sales conversation.
A total of impressions or reactions cannot answer whether that purpose is being served. A useful review combines the team's effort, the audience it is reaching, and specific examples of what happened next. Keep financial return claims tied to evidence your business can support.
Agree on the question before counting
Define what leadership wants to learn. A team selling engineered components may want to become more familiar to design engineers at target manufacturers. An equipment company may want buyers to involve its applications specialists earlier. Those objectives call for different evidence from a recruiting campaign.
Record the starting position where information is available. Consider current participation, relevant relationships, buyer questions, and known conversations connected to LinkedIn. Use a comparable reporting period and note changes such as a product launch, major exhibition, or expanded sales team.
Agree on the meaning of the measures you use. A business conversation should involve a relevant issue and an actual exchange. A meeting should have a clear purpose and participant. Reactions, acknowledgments, and substantive discussions should remain distinguishable in the review.
Use the five Cs to understand the work
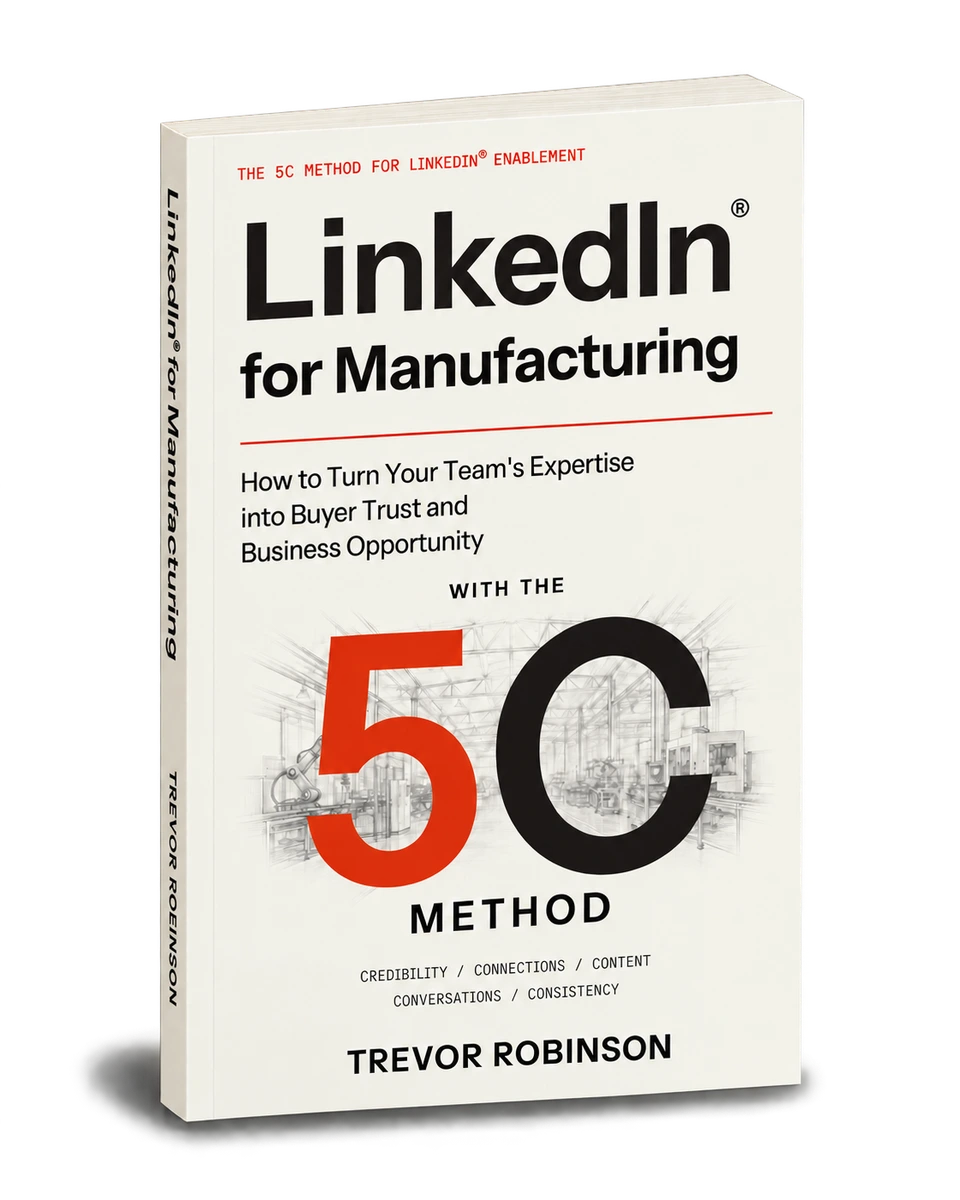
The 5C Method helps explain the activity behind the result. Under C1 Credibility, look at whether employee profiles accurately explain relevant experience and support their claims. Under C2 Connections, review whether the team is developing relationships with appropriate roles and companies.
C3 Content concerns the usefulness of the subjects, formats, and distribution. C4 Conversations concerns thoughtful comments, direct exchanges, and appropriate next steps. C5 Consistency concerns whether employees can maintain the work with the support and time available.
These observations help explain where the program needs attention. Strong technical posts reaching the wrong audience may point to a connections problem. Relevant questions left unanswered may point to a conversation or time-management problem. Simply asking for more posts would miss both.
Connect team activity to useful evidence
Apply the 5C Method to your team's buyers and sales process, with practical expectations for participation and progress.
Book a 30-Minute CallRecord the context of buyer conversations
When LinkedIn activity contributes to a commercial conversation, capture the connection while it is still clear. Note the relevant person or account, the topic discussed, the employee involved, and the agreed next step in your normal sales records. Keep personal details limited to what the business needs.
For example, a buyer might mention an engineer's post about washdown requirements during an application discussion. That is useful evidence of the content's role. It does not establish that the post created the entire opportunity. Record what the buyer actually said and how the conversation developed.
Distinguish an inquiry that began through LinkedIn from an existing opportunity where employee activity helped. If a seller already knew the account and a technical post prompted another stakeholder to join the discussion, describe that contribution accurately. The guide to engagement without leads examines this relationship between attention and buyer dialogue.
Include the effort required
Record the resources used to run the program: training, employee time, editing, management support, review, and any software. A program that depends on substantial behind-the-scenes assistance should include that effort when leadership considers its value.
Keep the cost basis consistent between reporting periods. If internal time is estimated, state the assumption. If a tool also supports other marketing work, agree with the relevant owner how its cost will be represented.
Use your organization's accepted financial reporting approach when calculating return. Opportunity value is not realized profit, and a deal influenced by several activities should not be fully credited to each one. When the available evidence cannot isolate a financial return, report the documented contribution and cost clearly rather than creating a precise-looking answer.
Make the review useful for decisions
Review useful examples alongside the totals. A small number of relevant conversations can reveal more about buyer interest than a large audience with little connection to the market. Equally, promising anecdotes should not hide a program that employees cannot sustain.
Choose a review period that fits the decision. Participation problems can be addressed quickly; commercial outcomes may need the normal length of your sales cycle to develop. Use the LinkedIn analytics guide to interpret the available performance evidence.
End each review with a specific change the evidence supports, such as improving audience selection, helping experts respond to questions, or reducing editorial effort. The employee advocacy program guide connects those improvements to team responsibilities.